> ## Documentation Index
> Fetch the complete documentation index at: https://docs.cubic.dev/llms.txt
> Use this file to discover all available pages before exploring further.
# Analytics
> Track your team's AI adoption, code review performance, and delivery velocity.
The analytics dashboard shows how your team ships code across three lenses: AI coding usage, AI review impact, and delivery speed. Data updates automatically from your GitHub activity.
 ## Dashboard tabs
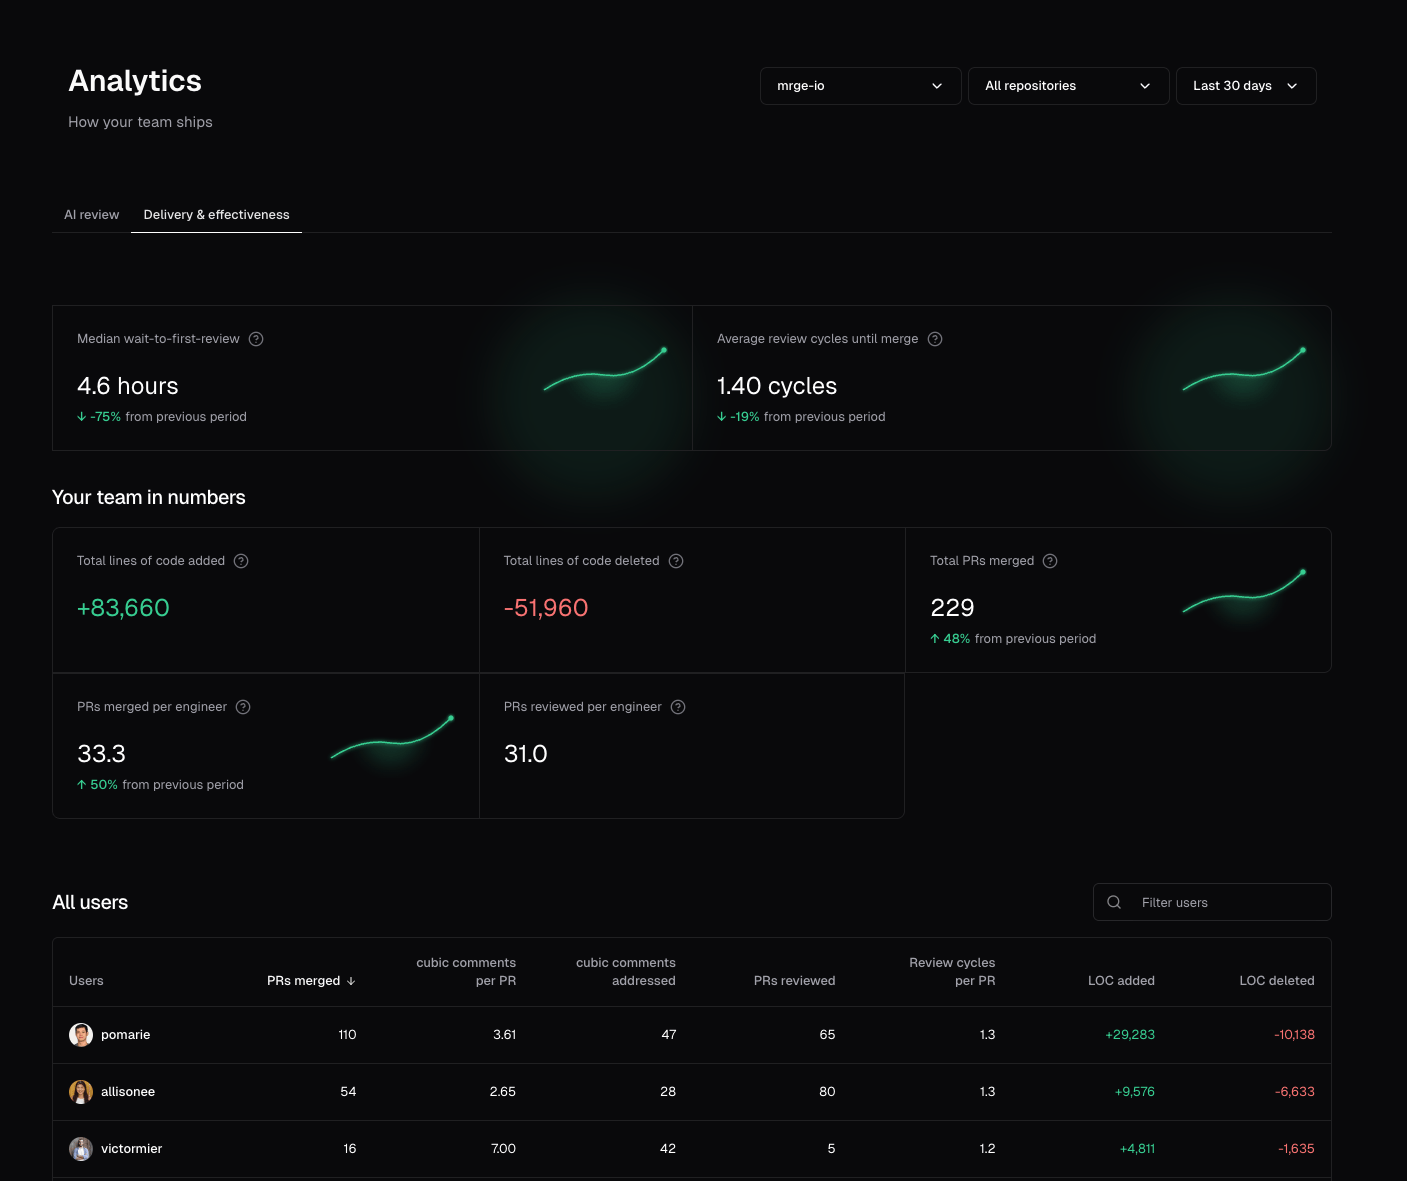
The [analytics page](https://www.cubic.dev/analytics) has three tabs:
* **[AI Coding](/analytics/ai-coding)**: Human vs AI authorship, tool/model usage, and team adoption by developer.
* **[AI Review](/analytics/ai-review)**: cubic's review volume, issues fixed, merge-time trend, and critical findings.
* **[Delivery and effectiveness](/analytics/delivery-and-effectiveness)**: review speed, cycle time, throughput, and delivery by team member.
Switch between tabs with keyboard shortcuts: press **c** (AI Coding), **a** (AI Review), or **d**
(Delivery and effectiveness).
## Filtering and time periods
### Repository filtering
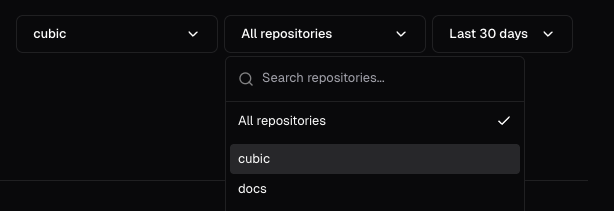
Focus on specific repositories to understand performance at a granular level. Switch between individual repos or view aggregate data across all repositories in your organization.
## Dashboard tabs
The [analytics page](https://www.cubic.dev/analytics) has three tabs:
* **[AI Coding](/analytics/ai-coding)**: Human vs AI authorship, tool/model usage, and team adoption by developer.
* **[AI Review](/analytics/ai-review)**: cubic's review volume, issues fixed, merge-time trend, and critical findings.
* **[Delivery and effectiveness](/analytics/delivery-and-effectiveness)**: review speed, cycle time, throughput, and delivery by team member.
Switch between tabs with keyboard shortcuts: press **c** (AI Coding), **a** (AI Review), or **d**
(Delivery and effectiveness).
## Filtering and time periods
### Repository filtering
Focus on specific repositories to understand performance at a granular level. Switch between individual repos or view aggregate data across all repositories in your organization.
 ### Flexible time periods
cubic supports quick ranges plus custom dates:
* Last 24 hours
* Last 7 days
* Last 30 days
* All time
* Custom range
Available time periods depend on when you installed cubic. Data collection starts from your
installation date, so some longer periods may not be available initially.
### Period-over-period comparisons
Most metrics include automatic period-over-period comparisons when enough historical data is available.
### Flexible time periods
cubic supports quick ranges plus custom dates:
* Last 24 hours
* Last 7 days
* Last 30 days
* All time
* Custom range
Available time periods depend on when you installed cubic. Data collection starts from your
installation date, so some longer periods may not be available initially.
### Period-over-period comparisons
Most metrics include automatic period-over-period comparisons when enough historical data is available.
 Comparisons are hidden when the previous period has no data or falls before your installation date.
## What cubic tracks
cubic automatically collects metrics about:
* AI tool adoption and code authorship patterns
* Pull request activity and merge velocity
* Review times and feedback loops
* AI review effectiveness and issue resolution
* CLI review activity
* Team member contributions
We frequently add new metrics. [Contact us](mailto:contact@cubic.dev?subject=Requesting%20a%20new%20metric) with suggestions.
## Team performance metrics
Comparisons are hidden when the previous period has no data or falls before your installation date.
## What cubic tracks
cubic automatically collects metrics about:
* AI tool adoption and code authorship patterns
* Pull request activity and merge velocity
* Review times and feedback loops
* AI review effectiveness and issue resolution
* CLI review activity
* Team member contributions
We frequently add new metrics. [Contact us](mailto:contact@cubic.dev?subject=Requesting%20a%20new%20metric) with suggestions.
## Team performance metrics
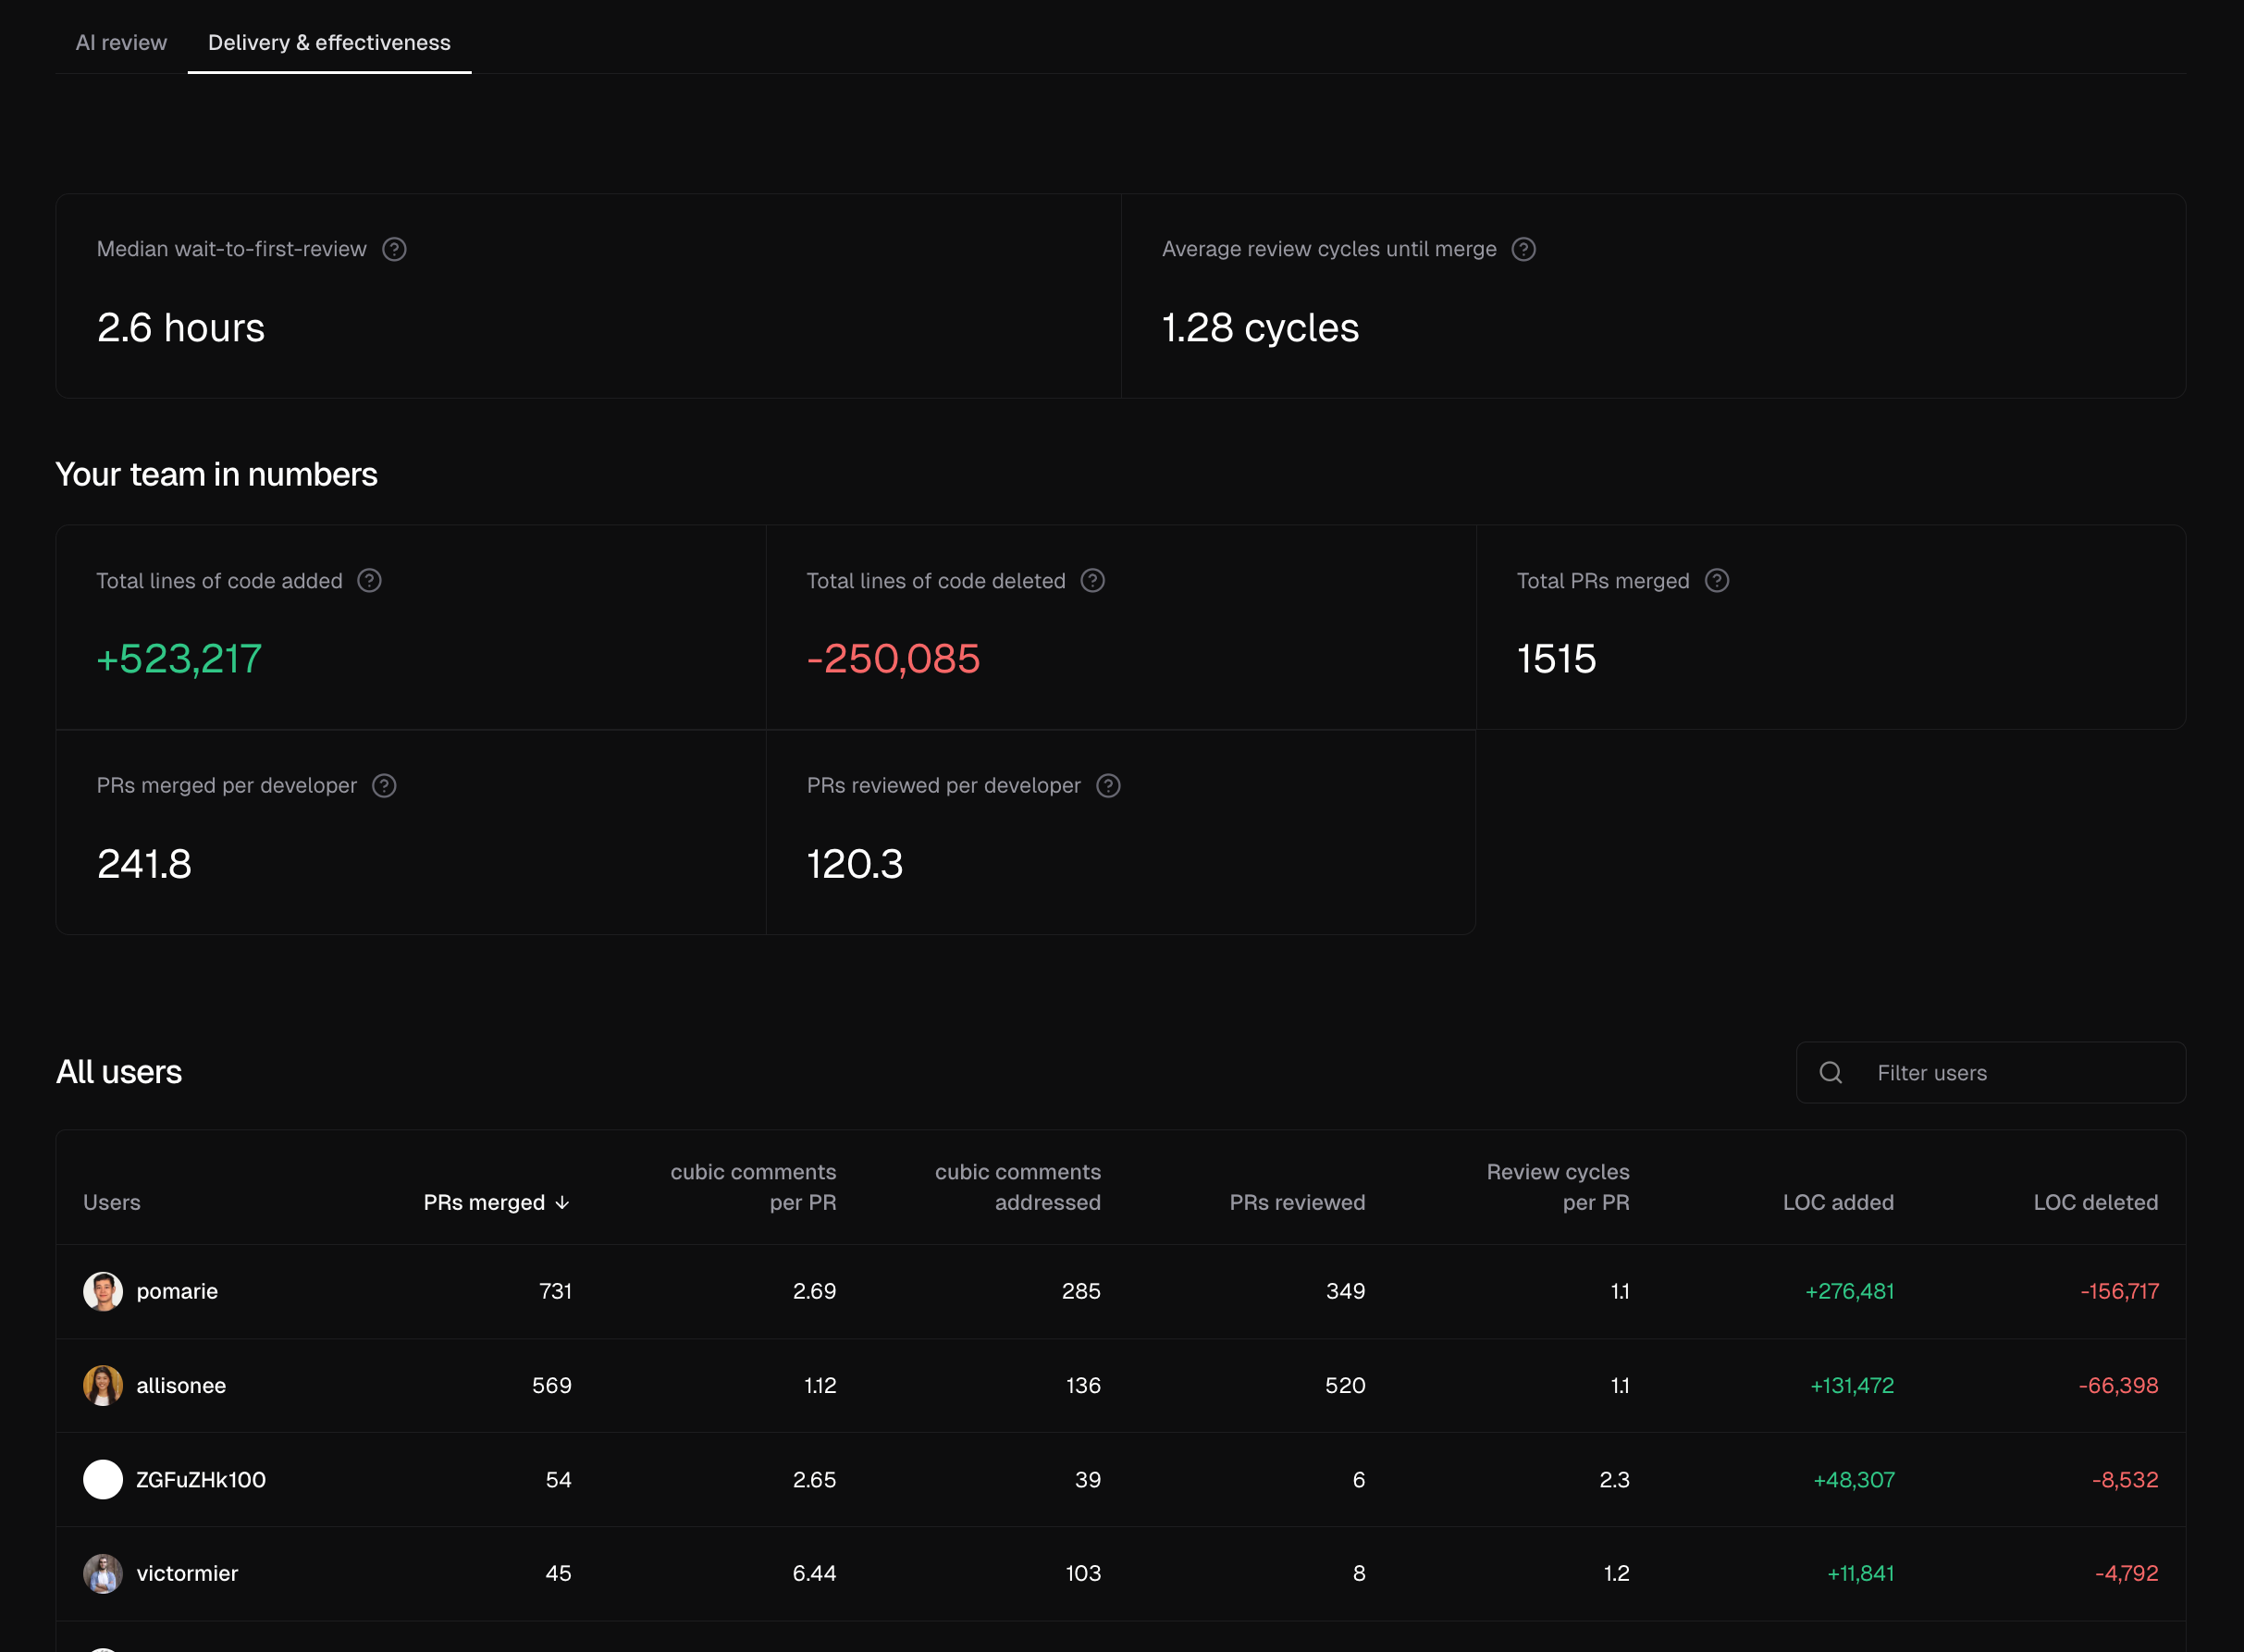 The [Delivery and effectiveness](/analytics/delivery-and-effectiveness) tab includes a team members table with per-developer metrics: PRs reviewed, comments addressed, review cycles, and lines of code changed. Click column headers to sort, and filter by GitHub username.
You can export team member data as CSV from both [AI coding](/analytics/ai-coding#csv-export) and [Delivery and effectiveness](/analytics/delivery-and-effectiveness#csv-export) for reporting and sharing with stakeholders.
The [Delivery and effectiveness](/analytics/delivery-and-effectiveness) tab includes a team members table with per-developer metrics: PRs reviewed, comments addressed, review cycles, and lines of code changed. Click column headers to sort, and filter by GitHub username.
You can export team member data as CSV from both [AI coding](/analytics/ai-coding#csv-export) and [Delivery and effectiveness](/analytics/delivery-and-effectiveness#csv-export) for reporting and sharing with stakeholders.