Dashboard tabs
The analytics page has three tabs:- AI Coding: Human vs AI authorship, tool/model usage, and team adoption by developer.
- AI Review: cubic’s review volume, issues fixed, merge-time trend, and critical findings.
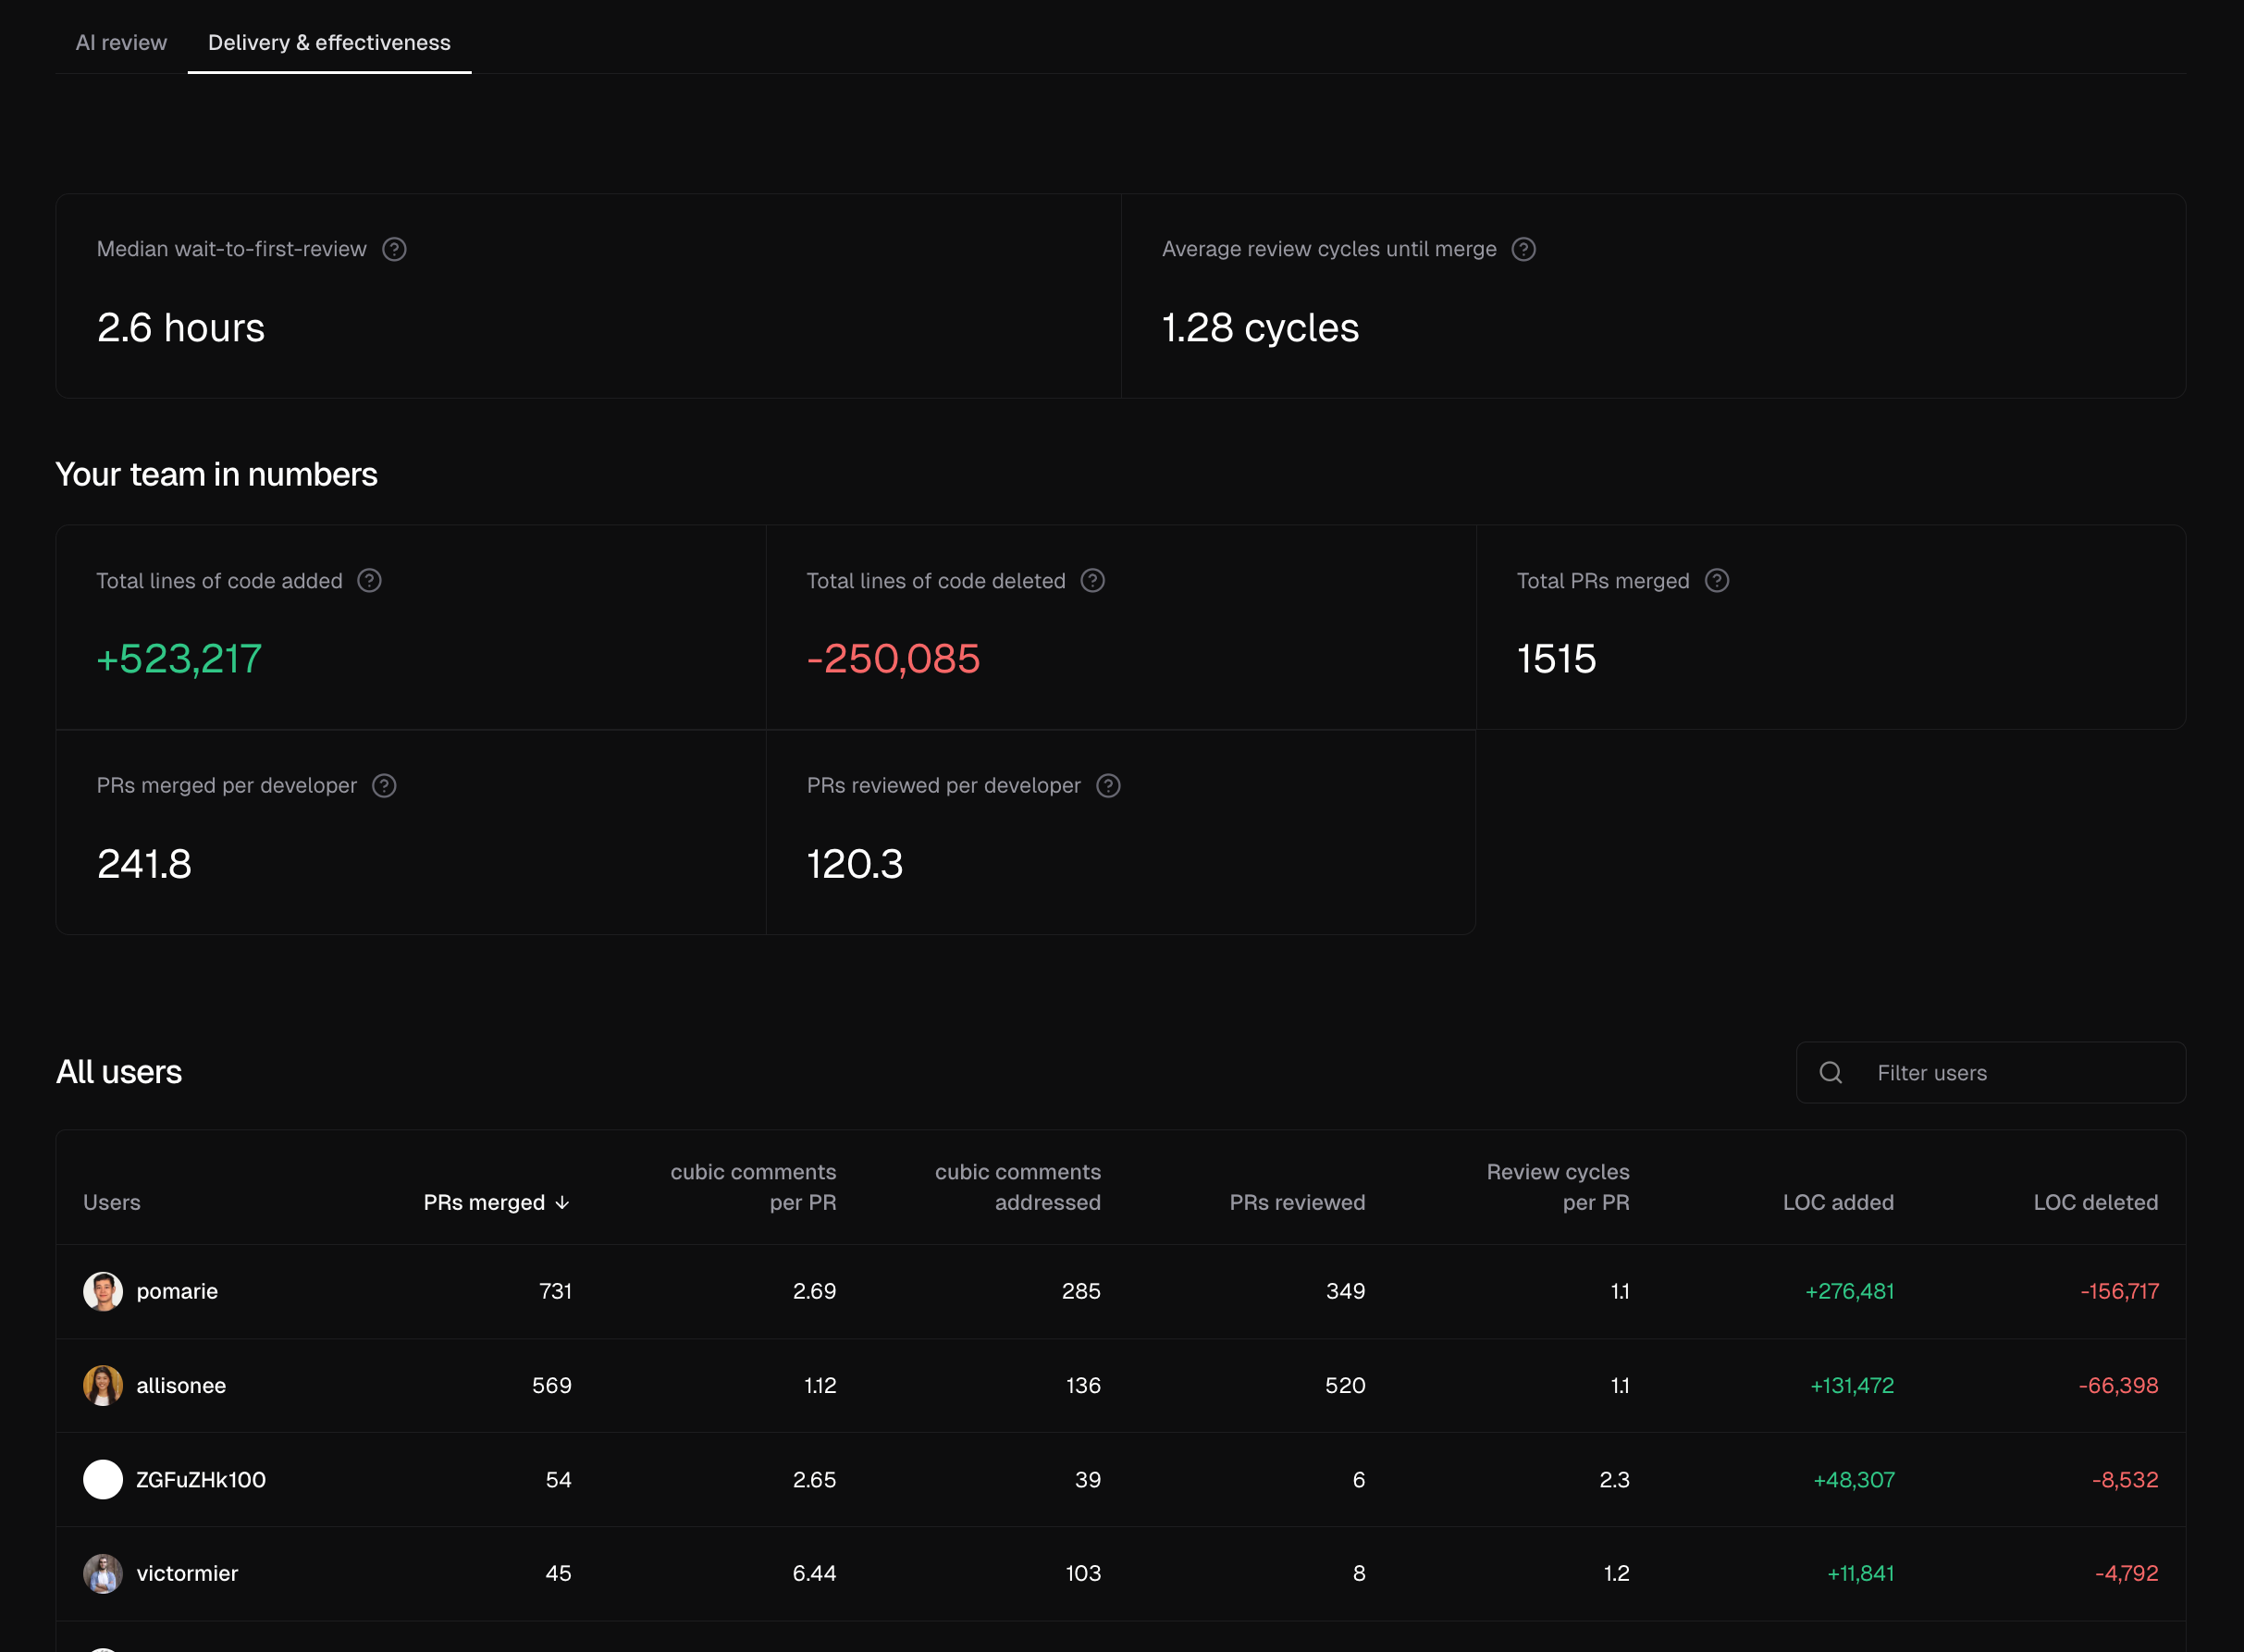
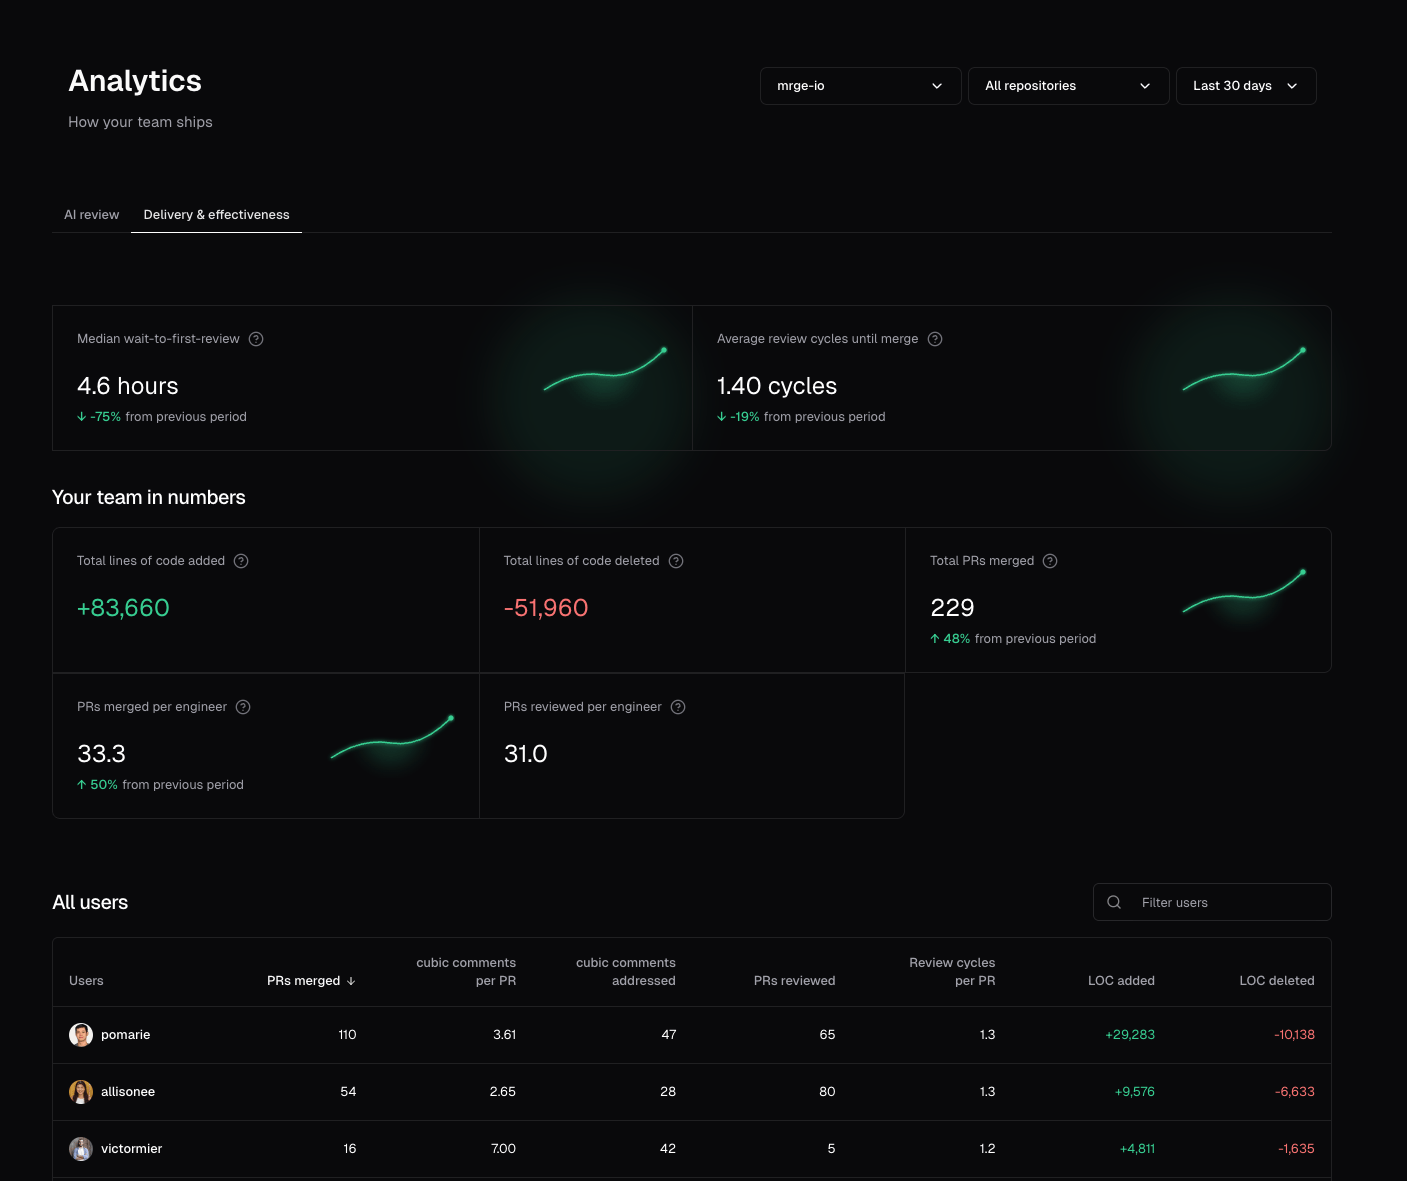
- Delivery and effectiveness: review speed, cycle time, throughput, and delivery by team member.
Switch between tabs with keyboard shortcuts: press c (AI Coding), a (AI Review), or d
(Delivery and effectiveness).
Filtering and time periods
Repository filtering
Focus on specific repositories to understand performance at a granular level. Switch between individual repos or view aggregate data across all repositories in your organization.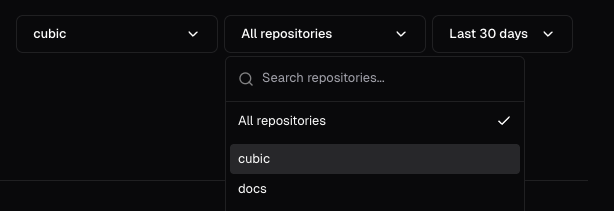
Flexible time periods
cubic supports quick ranges plus custom dates:- Last 24 hours
- Last 7 days
- Last 30 days
- All time
- Custom range
Available time periods depend on when you installed cubic. Data collection starts from your
installation date, so some longer periods may not be available initially.
Period-over-period comparisons
Most metrics include automatic period-over-period comparisons when enough historical data is available.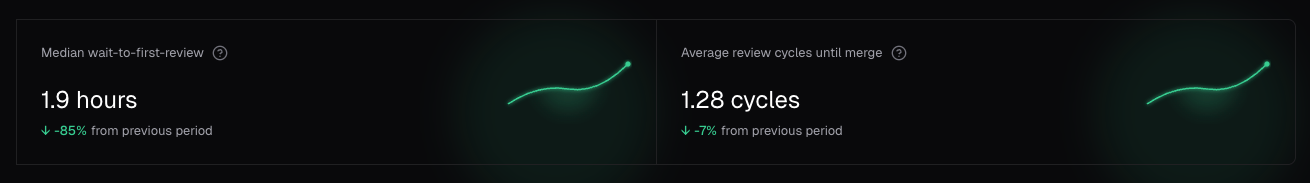
What cubic tracks
cubic automatically collects metrics about:- AI tool adoption and code authorship patterns
- Pull request activity and merge velocity
- Review times and feedback loops
- AI review effectiveness and issue resolution
- CLI review activity
- Team member contributions
Team performance metrics